Showing posts with label statistics. Show all posts

Sunday, 1 February 2026

Describing trends. Statistics

  Describing changes. The world of statistics


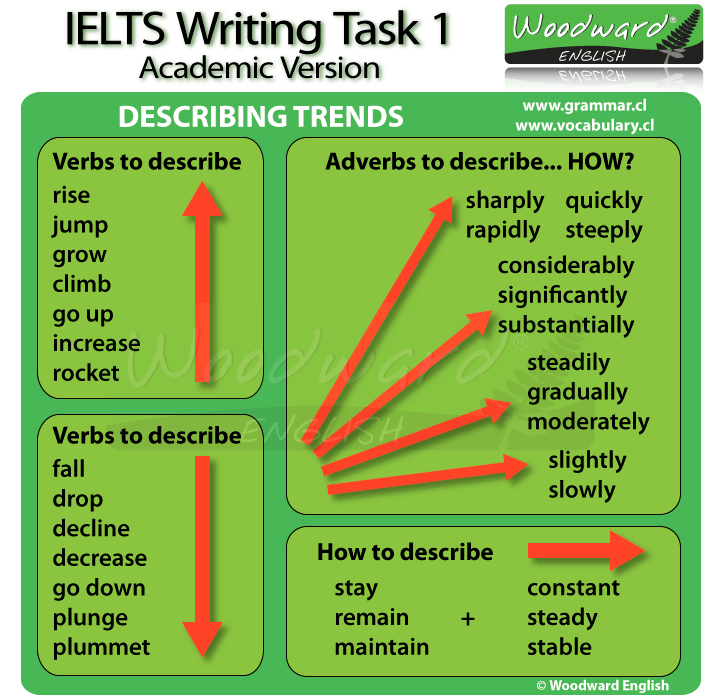
Verbs to describe an upward trend

The following verbs can be used to describe a trend or pattern that goes up.

  • climb (past: climbed)
  • go up (past: went up)
  • grow (past: grew)
  • increase (past: increased)
  • jump (past: jumped)
  • rise (past: rose)
  • rocket (past: rocketed)

Sentence examples using words that show an upward trend:

  • The number of enrolments increased significantly between 2005 and 2010.
  • Production rose from 800 units in May to 1000 units the following month.

Verbs to describe a downward trend

The following verbs can be used to describe a trend or pattern that goes down.

  • decline (past: declined)
  • decrease (past: decreased)
  • drop (past: dropped)
  • fall (past: fell)
  • go down (past: went down)
  • plummet (past: plummeted) = to fall or drop suddenly in amount or value
  • plunge (past: plunged) = to fall or drop suddenly in amount or value

Plunge and Plummet, when describing trends, have the same meaning.

Sentence examples using words that show a downward trend:

  • Prices of Model X dropped significantly once Model Y became available on the market.
  • Company profits decreased in 2013 by 15%.

Words and phrases used to describe a stable trend

To describe a more or less stable pattern, you can use the following expressions:

  • maintain (past: maintained)
  • remain (past: remained)
  • stay (past: stayed)
  • constant
  • stable
  • steady
  • unchanged

Adverbs used when describing trends

Adverbs describe HOW something happens. They usually come after a verb.

  • sharply, rapidly, quickly, steeply
  • considerably, significantly, substantially
  • steadily, gradually, moderately
  • slightly, slowly

Nouns used when describing trends

  • decline
  • decrease
  • dip (a momentarily small drop in the level of something)
  • drop
  • fall
  • fluctuation (= an irregular rising and falling in number or amount; a variation)
  • growth
  • increase
  • peak (= the highest point)
  • rise
  • slump (= a severe or prolonged fall in the price, value, or amount of something)
  • variation (= a change or difference in condition, amount, or level)
IELTS Academic Writing Task 1 - Describing Trends Vocabulary
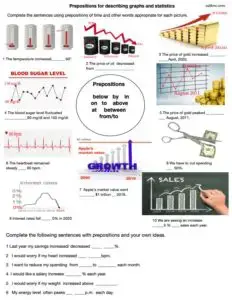
Prepositions for graphs,trends and statistics 

Describing graphs and trends. 

Monday, 3 June 2024

Vegan economy

Mar 22, 2018. It's the 'environmentally friendly' diet that's taking the world by storm. Veganism is quickly becoming more mainstream. And the UK, in particular, has seen huge growth in the vegan food sector - companies are scrambling to sink their teeth into the market. But is 2018 really the year of veganism, or is it all just a fad? Katie Gregory takes a look.


Wednesday, 21 September 2022

Describing changes. The world of statistics


Verbs to describe an upward trend

The following verbs can be used to describe a trend or pattern that goes up.

  • climb (past: climbed)
  • go up (past: went up)
  • grow (past: grew)
  • increase (past: increased)
  • jump (past: jumped)
  • rise (past: rose)
  • rocket (past: rocketed)

Sentence examples using words that show an upward trend:

  • The number of enrolments increased significantly between 2005 and 2010.
  • Production rose from 800 units in May to 1000 units the following month.

Verbs to describe a downward trend

The following verbs can be used to describe a trend or pattern that goes down.

  • decline (past: declined)
  • decrease (past: decreased)
  • drop (past: dropped)
  • fall (past: fell)
  • go down (past: went down)
  • plummet (past: plummeted) = to fall or drop suddenly in amount or value
  • plunge (past: plunged) = to fall or drop suddenly in amount or value

Plunge and Plummet, when describing trends, have the same meaning.

Sentence examples using words that show a downward trend:

  • Prices of Model X dropped significantly once Model Y became available on the market.
  • Company profits decreased in 2013 by 15%.

Words and phrases used to describe a stable trend

To describe a more or less stable pattern, you can use the following expressions:

  • maintain (past: maintained)
  • remain (past: remained)
  • stay (past: stayed)
  • constant
  • stable
  • steady
  • unchanged

Adverbs used when describing trends

Adverbs describe HOW something happens. They usually come after a verb.

  • sharply, rapidly, quickly, steeply
  • considerably, significantly, substantially
  • steadily, gradually, moderately
  • slightly, slowly

Nouns used when describing trends

  • decline
  • decrease
  • dip (a momentarily small drop in the level of something)
  • drop
  • fall
  • fluctuation (= an irregular rising and falling in number or amount; a variation)
  • growth
  • increase
  • peak (= the highest point)
  • rise
  • slump (= a severe or prolonged fall in the price, value, or amount of something)
  • variation (= a change or difference in condition, amount, or level)

IELTS Academic Writing Task 1 - Describing Trends Vocabulary
Prepositions for graphs,trends and statistics 

Prepositions when they try to use statistics to describe graphs and trends. 

Prepositions for talking about graphs, trends and statistics

Prepositions for graphs and statistics (PDF)

Prepositions for graphs and statistics

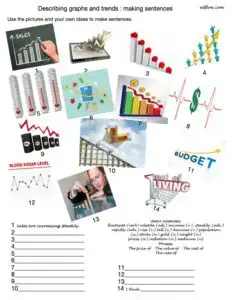
Describing  graphs and trends: making sentences  worksheet 

This is  a worksheet to help  English language learners write and talk about graphs and trends. Students try to write appropriate sentences for the pictures using the vocabulary at the bottom of the page.

Describing graphs writing exericise

Describing graphs sentence writing (PDF)

Listen to the audio and fill in the missing words

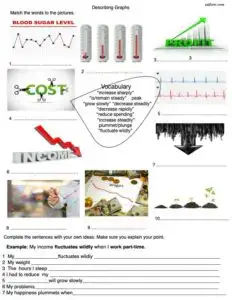
Describing graphs vocabulary and personalized sentence writing activity.

Describing graphs vocabulary and sentence writing (PDF)

(see the video version on Youtube)

Describing graphs and sentence writing

Describing graphs and trends

Wednesday, 29 September 2021

Practice makes perfect


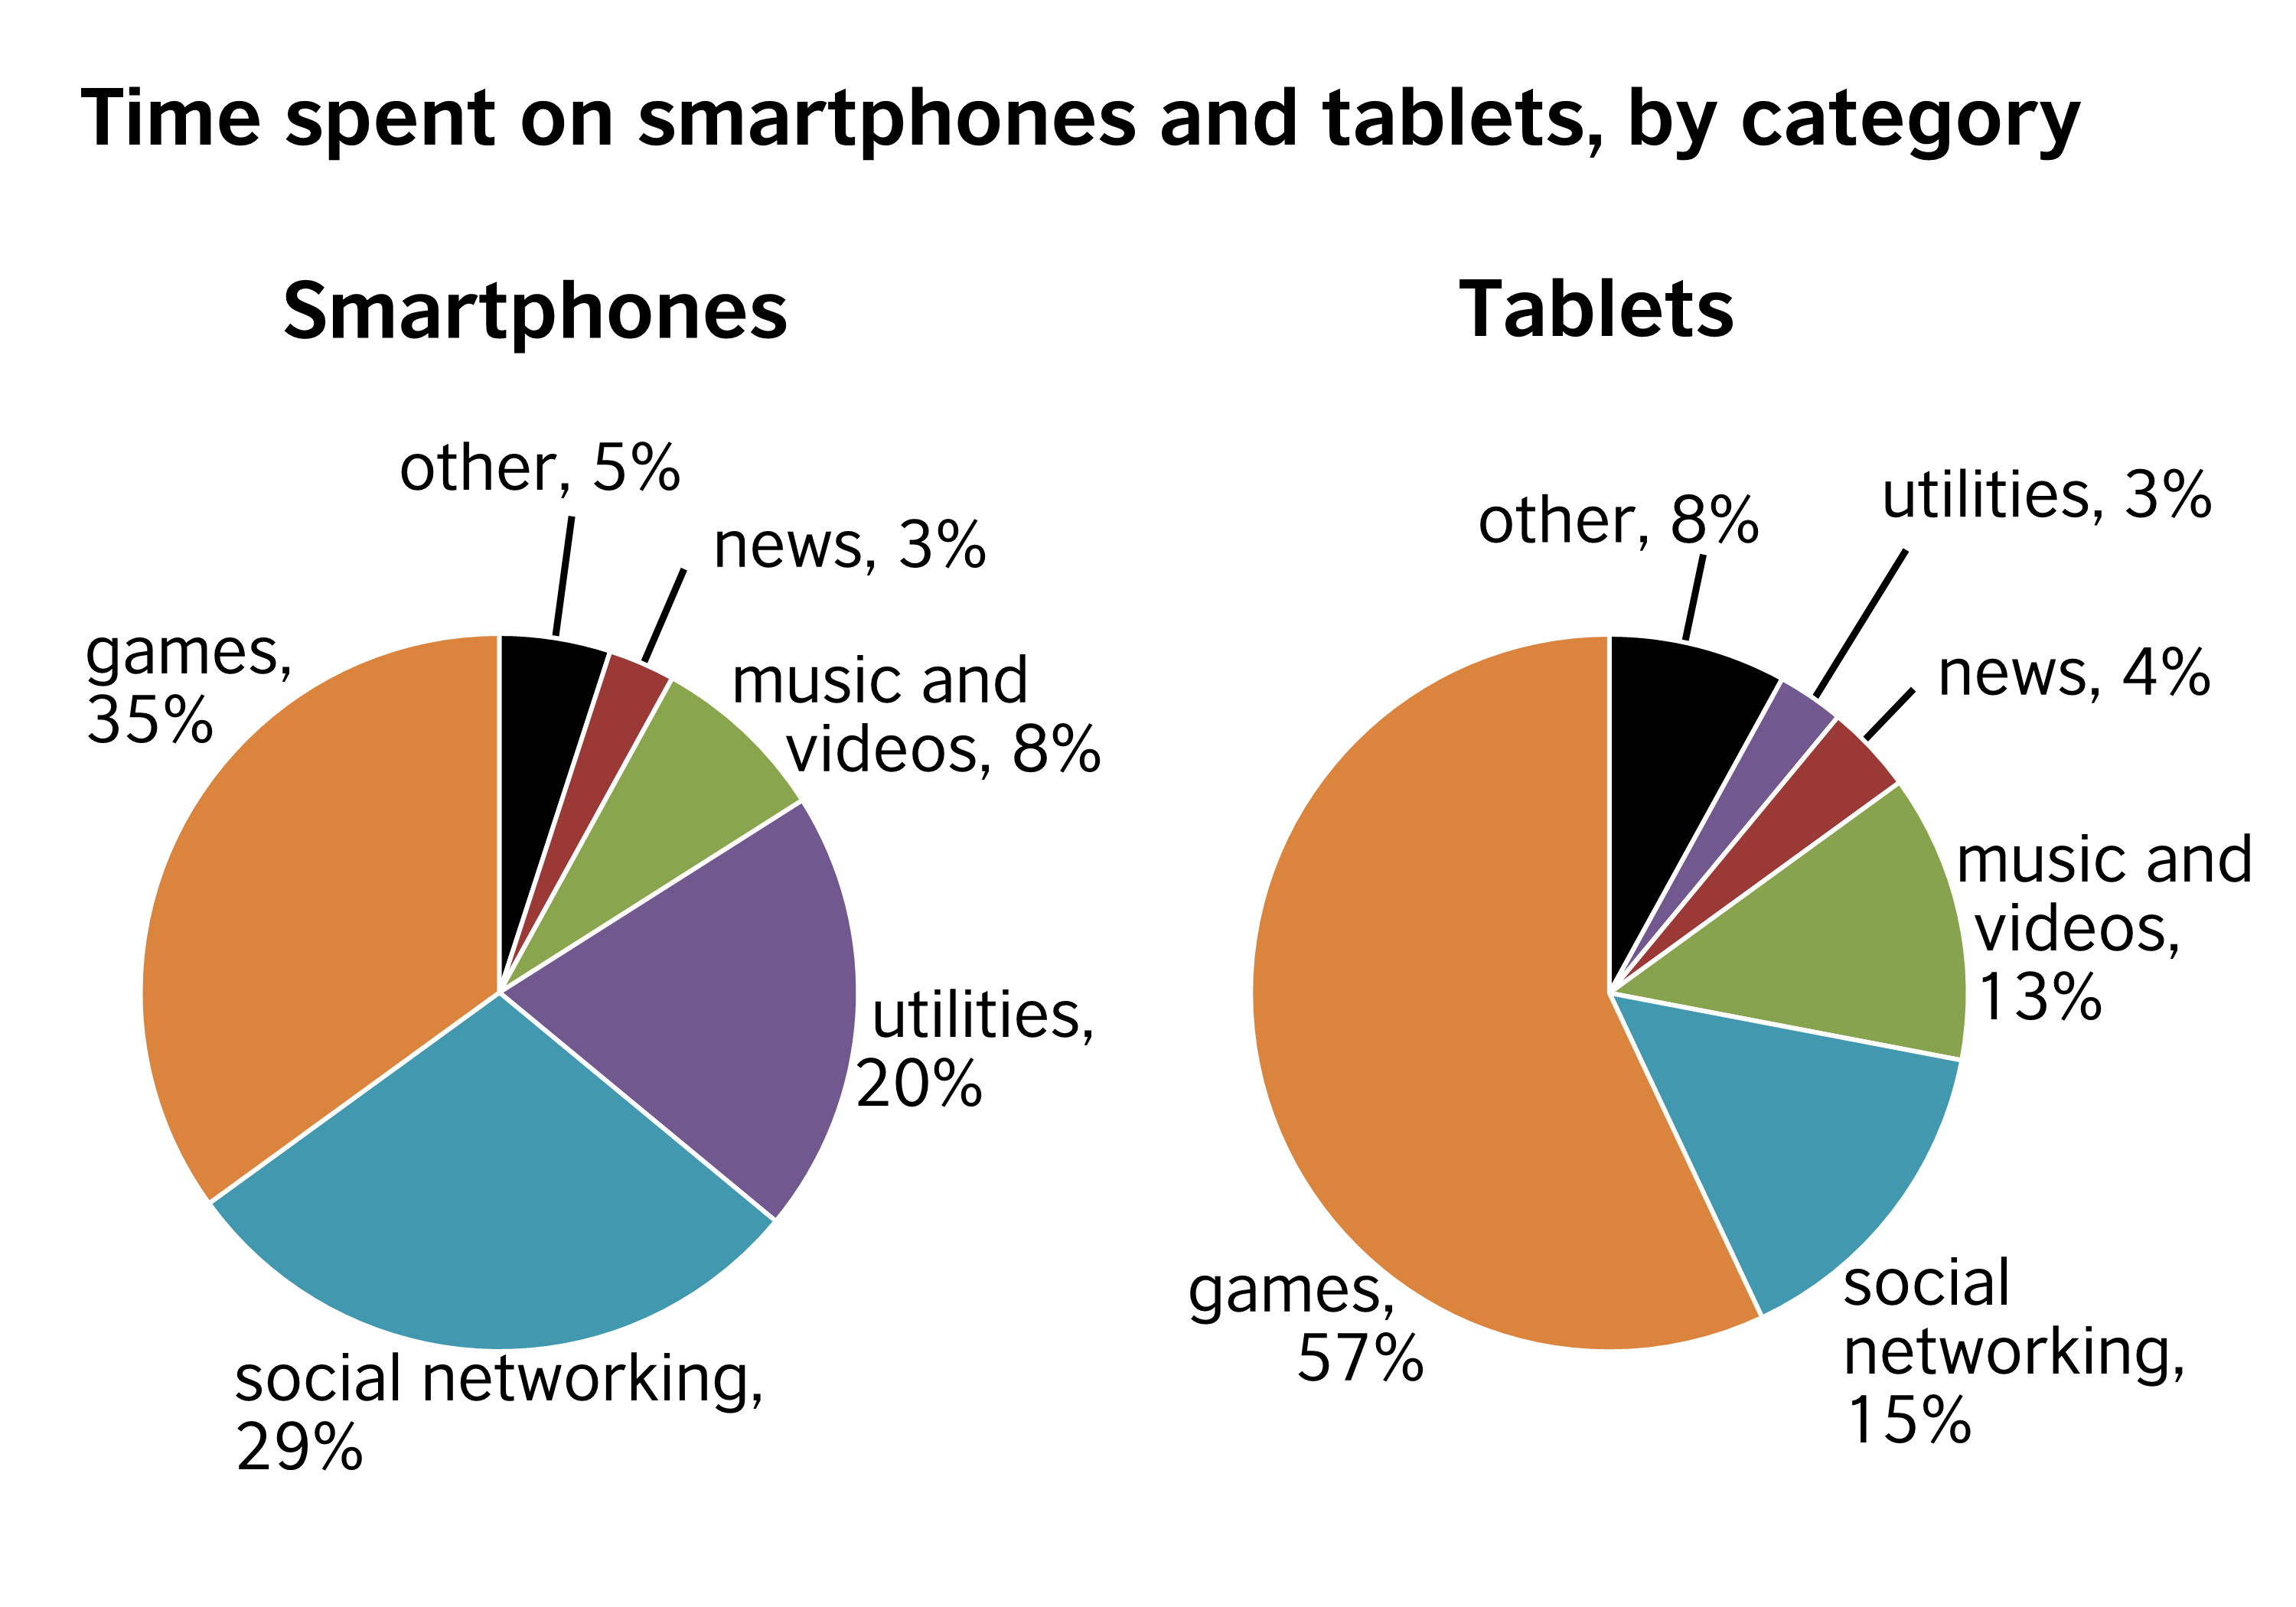
Overall, the two pie charts show that smartphones and tablets are used for the same purposes but to very different extents. 

The first pie chart shows how people spend their time on smartphones while the second pie chart illustrates how time is spent on tablets. For both types of device, the top use is for games, but the figures differ greatly. 57% of the time spent on a tablet is given to playing games, while only 35% of the time spent on a smartphone is used for this. In contrast, smartphone users spend 29% of their time on their gadget accessing social networking sites compared with just 15% of tablet time spent on the same activity.

The third most popular use of the tablet is for consuming entertainment, with users spending 13% of their tablet time watching videos and listening to music. Smartphone users, however, dedicate only 8% of their smartphone time to such entertainment, preferring instead to spend 20% of their time on their phone accessing utilities. These can include maps, weather information and calculators.

There is a clear difference in the way people are using their smartphones and tablets. In general, while tablets are being used more for gaming and other forms of entertainment, smartphones seem to be the preferred option for tasks as well as communication with the world around us.

Please note: This page was designed for writing practice only. Information in the charts may not be accurate.

Tuesday, 21 September 2021

Describing trends: Case Study COVID cases

 https://www.bbc.com/news/world-51235105

Covid-19 is continuing to spread around the world, with more than 228 million confirmed cases and almost 4.7 million deaths across almost 200 countries

Prepositions for graphs,trends and statistics 

   I’ve always been familiar with prepositions for location, time and movement. But for years I have been teaching English for graphs and statistics to medical technology students. And I’ve noticed a recurring problem with prepositions when they try to use statistics to describe graphs and trends. So, finally I’ve done something about it.  

Prepositions for talking about graphs, trends and statistics

Prepositions for graphs and statistics (PDF)

Prepositions for graphs and statistics

Describing  graphs and trends: making sentences  worksheet 

This is  a worksheet to help  English language learners write and talk about graphs and trends. Students try to write appropriate sentences for the pictures using the vocabulary at the bottom of the page.

Describing graphs writing exericise

Describing graphs sentence writing (PDF)

Describing graphs and trends

Tuesday, 29 September 2020

Work leave-Language practice-STATISTICS

 ACTIVITIES TO PRACTISE THE USE OF ENGLISH AND WRITING SKILLS.

Read the information in your books (pgs134-135-136) and check the vocabulary and grammar of the writing samples provided. 

Then, do these exercises to be sent by mail:

PLEASE SEND SUBMIT YOUR ANSWERS BY MAIL BEFORE FRI. FOR ANY QUESTIONS, DO PLEASE CONTACT AT: javier.martinez@educantabria.es 

Practice Task 1
Look at the following sentences. Some are correct whilst others contain mistakes. Can you tell which ones are wrong and why?

  1. There was a slight rising in the cost of fuel at the beginning of winter.
  2. In October the number of tourists was a plummet .
  3. The proportion of people using the bus in June increased slightly, whereas, those travelling by car fell impressively.
  4. There was huge increase in the production of tea in the 19th century.
  5. Next year it is projected that the numbers of people using social media will fall gradual.
Practice Task 2
The following sentences contain verb phrases to describe statistics. Rewrite them with noun phrases. For example – The number rose. / There was a rise in the number.

  1. The price of cat food surged from $1.50 to $2.00 a can in late 2010
  2. The price of oil dropped steadily towards the end of the decade.
  3. The number of people moving to the city remained steady during the period.
  4. The government reduced subsidies and prices fluctuated wildly for the rest of the year.
  5. The percentage of people travelling to work by bus increased dramatically from 11% to 23% while the percentage using cars dropped slightly to 18%.
Practice Task 3
The graph below shows the price of apples and oranges between 1999 and 2003. Write a short report about the change in the price of apples and oranges shown in the graph. Make sure you use both verb and noun phrases in your description.