
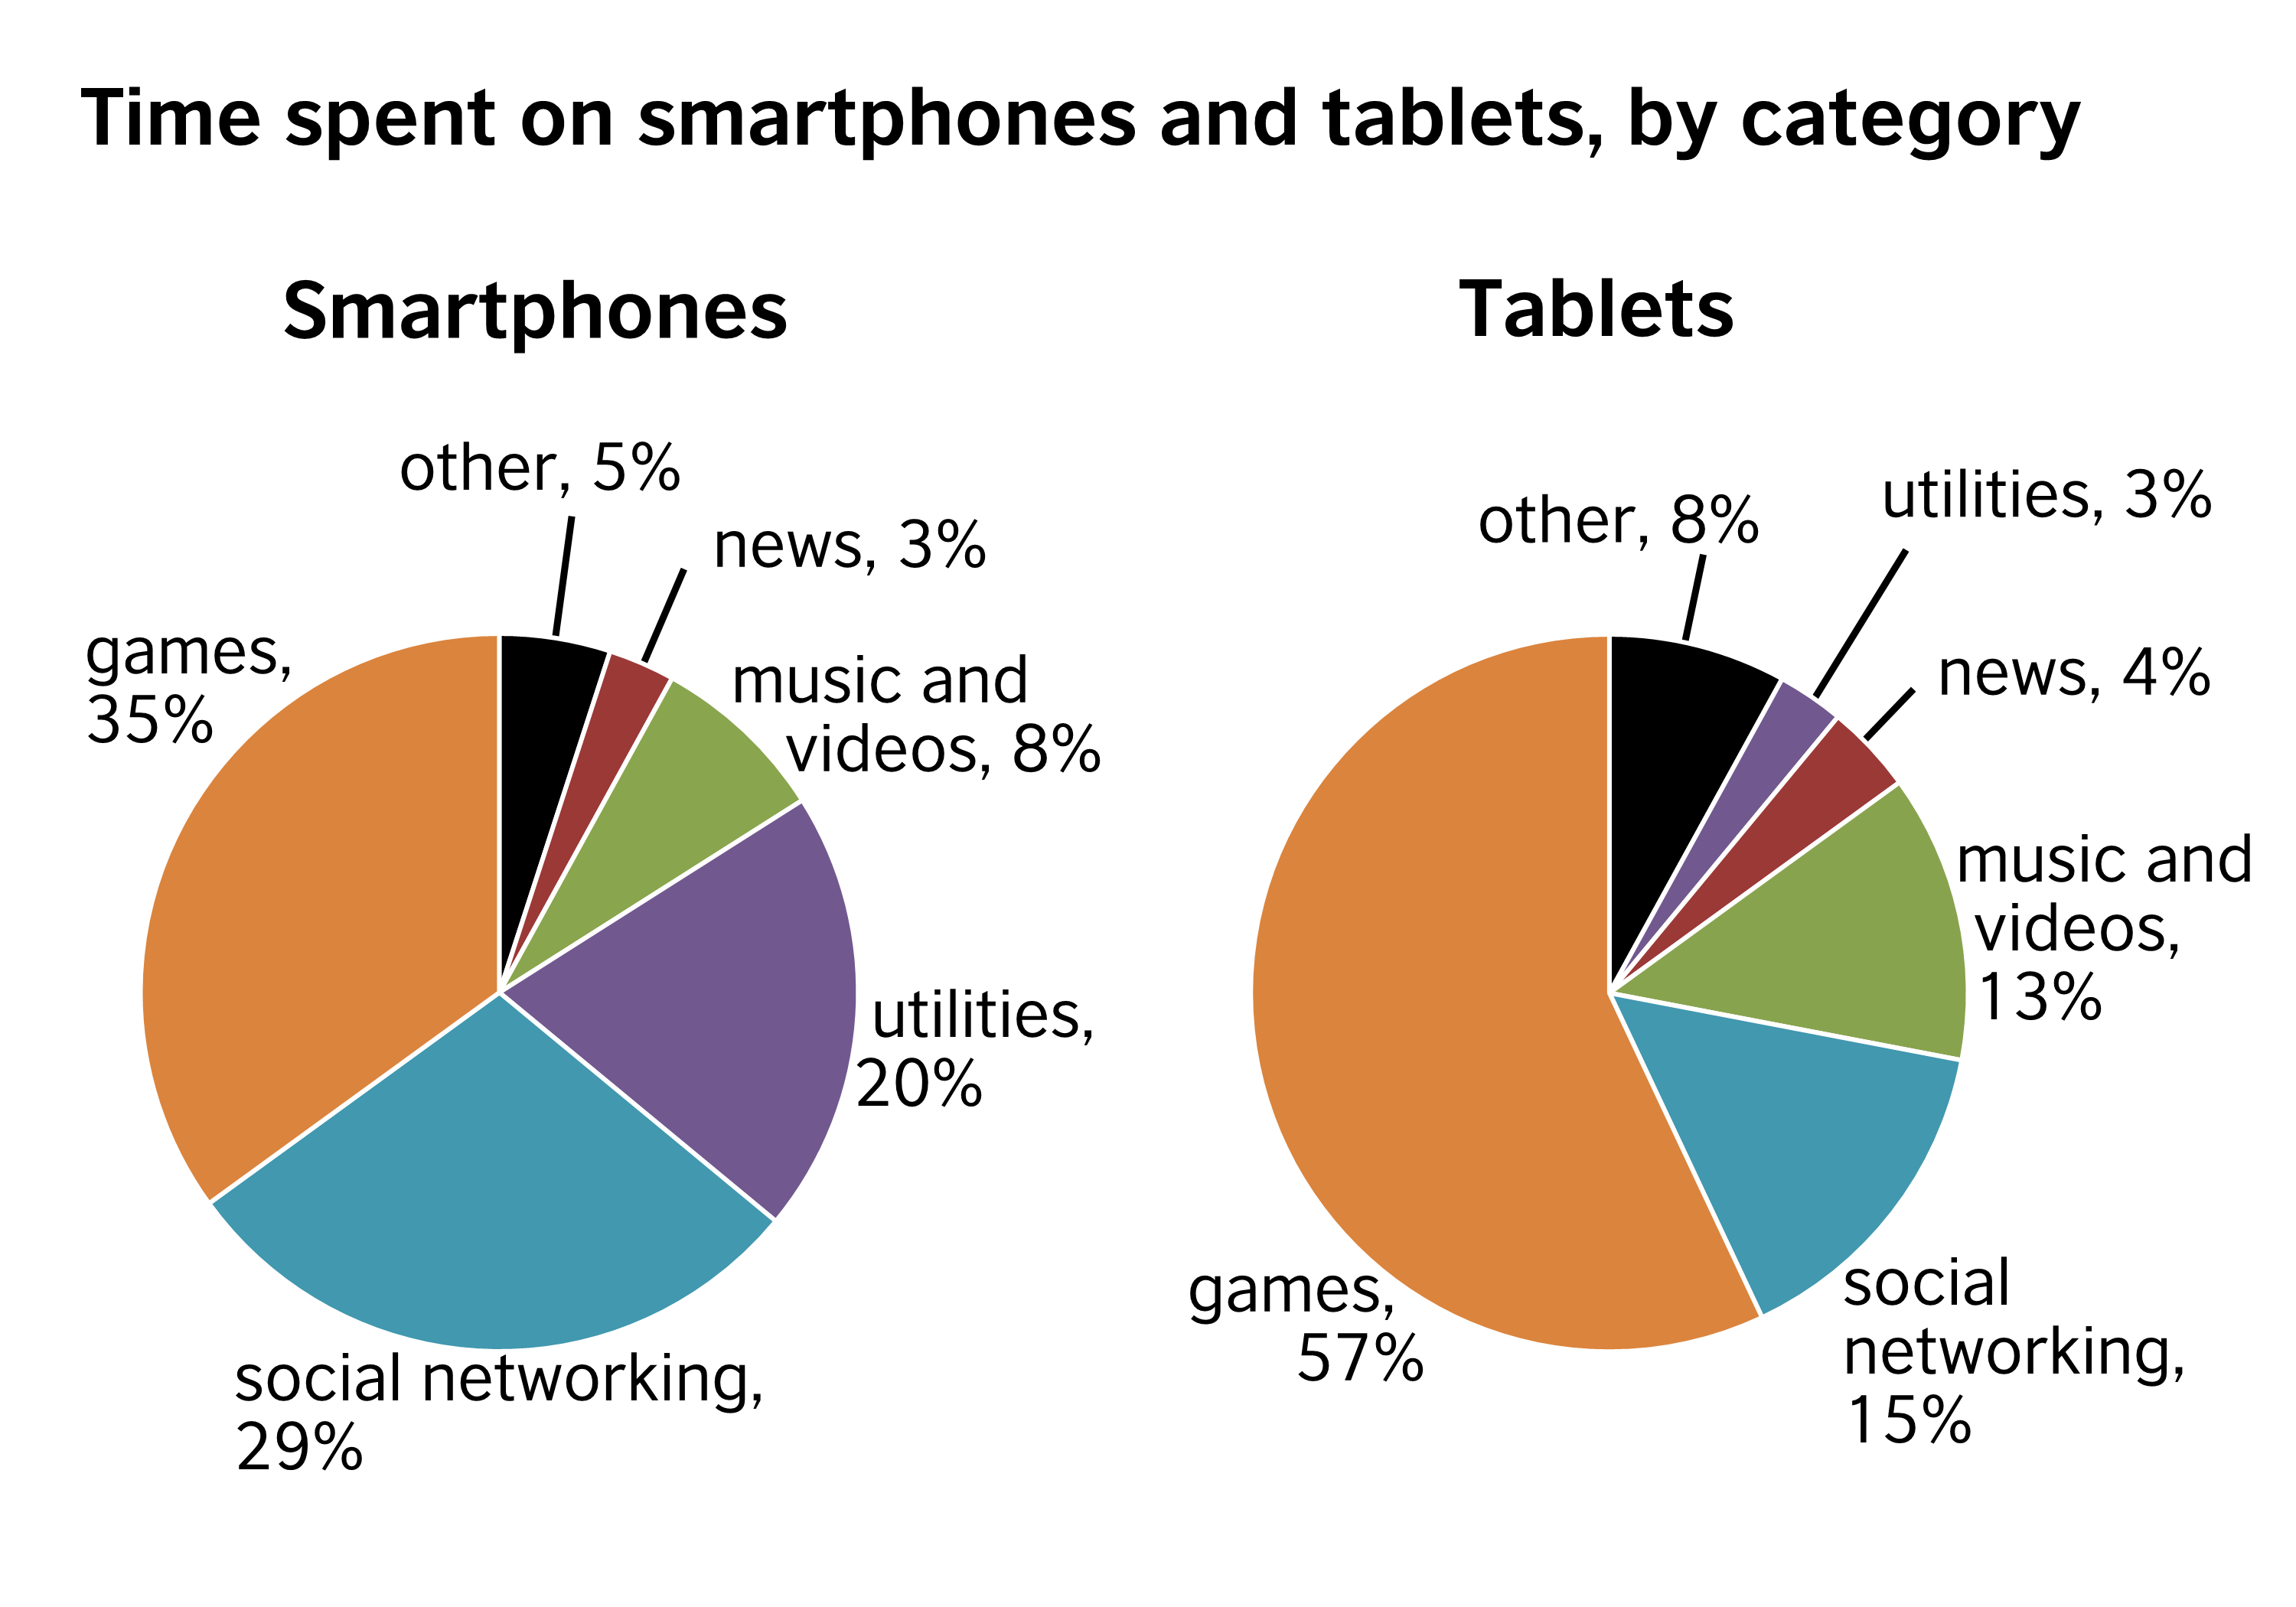
Overall, the two pie charts show that smartphones and tablets are used for the same purposes but to very different extents.
The first pie chart shows how people spend their time on smartphones while the second pie chart illustrates how time is spent on tablets. For both types of device, the top use is for games, but the figures differ greatly. 57% of the time spent on a tablet is given to playing games, while only 35% of the time spent on a smartphone is used for this. In contrast, smartphone users spend 29% of their time on their gadget accessing social networking sites compared with just 15% of tablet time spent on the same activity.
The third most popular use of the tablet is for consuming entertainment, with users spending 13% of their tablet time watching videos and listening to music. Smartphone users, however, dedicate only 8% of their smartphone time to such entertainment, preferring instead to spend 20% of their time on their phone accessing utilities. These can include maps, weather information and calculators.
There is a clear difference in the way people are using their smartphones and tablets. In general, while tablets are being used more for gaming and other forms of entertainment, smartphones seem to be the preferred option for tasks as well as communication with the world around us.
Please note: This page was designed for writing practice only. Information in the charts may not be accurate.
No comments:
Post a Comment